
Continuing our guide to supporting partners and customers through Acumatica’s Modern UI transition
As Acumatica accelerates its shift toward the Modern UI introduced in 25R2, partners and customers are recognizing a new reality: migrating customizations is not simply a visual redesign – it is a technical transformation that varies significantly from screen to screen.
At Sprinterra, we have already migrated hundreds of modified and fully custom Acumatica screens across our ISV solutions and customer projects. Through this experience, we developed an objective, repeatable method to estimate the true complexity and effort required for each migration. This process forms the foundation of our Modern UI Migration Assessment, delivered through our automated tools.
Below is an overview of the methodology behind our estimation model.
Every Acumatica customization is unique. Some extend existing screens with minor UI tweaks. Others introduce fully custom functionality built years ago using Classic UI components.
Because Acumatica plans to fully retire the Classic UI, customers need a reliable way to estimate:
Sprinterra’s approach delivers clarity and predictability long before migration work begins.
Our estimation model is based on quantitative analysis of the underlying XML and ASPX files that define Acumatica screens. The methodology is fully documented in our technical guide .
Every screen falls into one of two categories:
These categories behave differently during migration, so each receives a weighted effort factor.
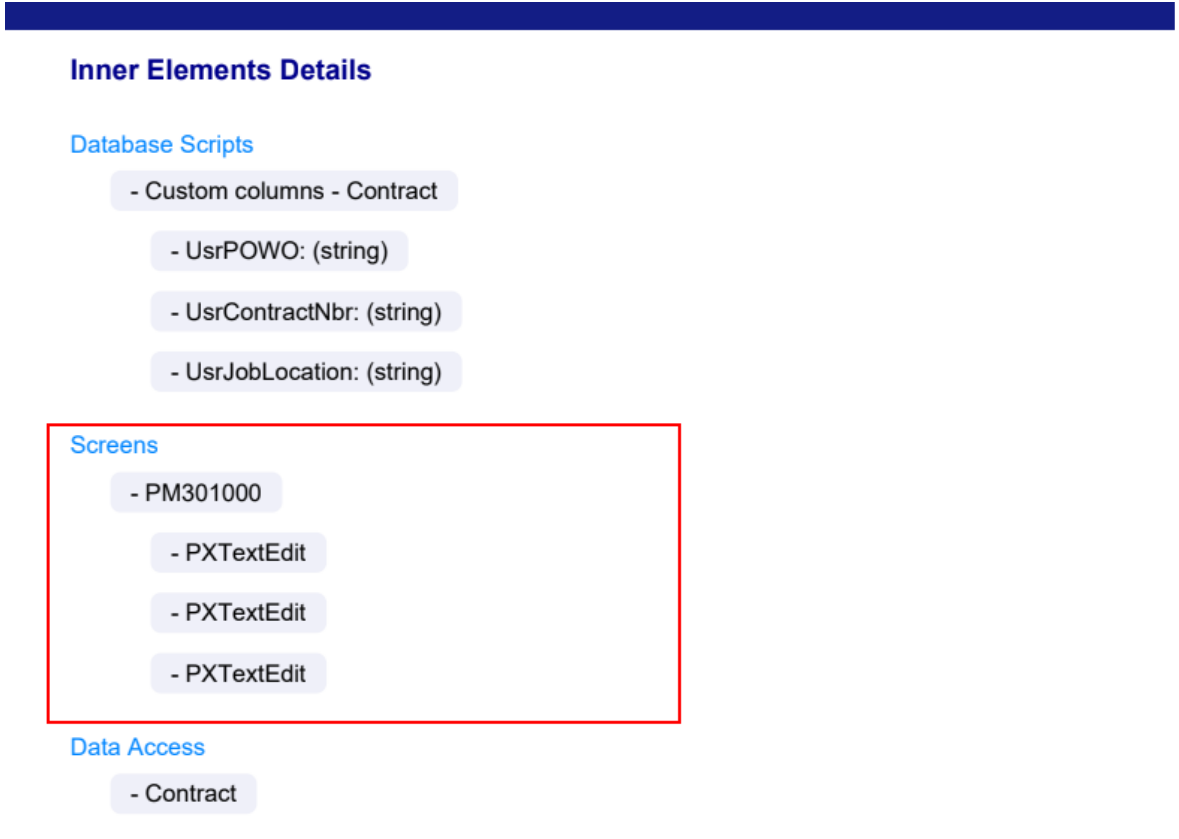
Each XML/ASPX file contains a structure made of tags – fields, containers, grids, buttons, actions, and layout elements.
Sprinterra’s assessment tool automatically scans each screen and:
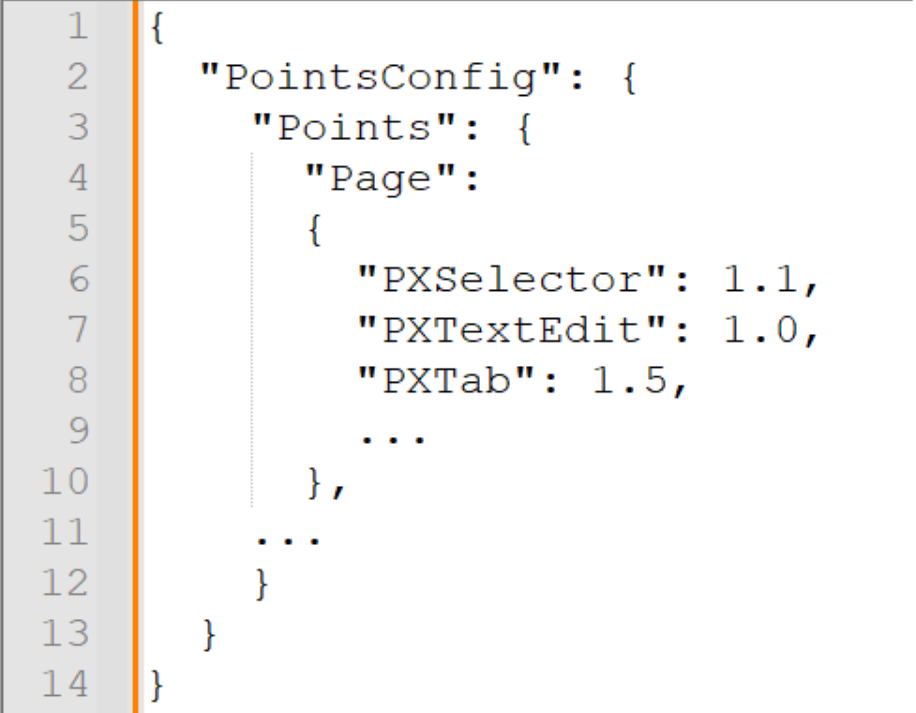
Today, each tag = 1 complexity point, though a more granular weighted model is planned.
This allows us to objectively measure structural complexity rather than relying on subjective estimates.
A planned enhancement for future versions of the utility is the implementation of granular complexity weighting. This involves assigning a distinct point value to each tag type, reflecting its relative complexity of implementation.
Example:
Using real-world migration data, we established Average Productivity Rates (APR):
This means customized screens require more effort per tag, while fully custom screens are generally more straightforward.
The formula is:
Total Hours = (Customized Points / 16) + (Custom Points / 24)
(Regression testing added separately.)
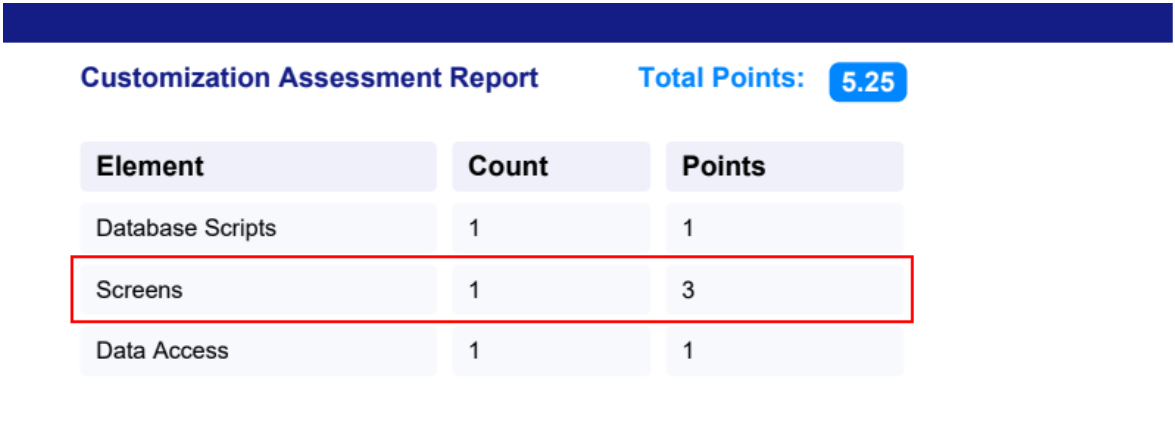
Our Customization Assessment Tool produces structured outputs, including:
These reports give partners and customers a transparent view of the effort required – before investing in migration.
The following example is based on the analysis of a completed migration project covering four packages, which together included:
Total tag count: 2,755
Based on this real-world case, the average migration rate was approximately 20 tags (points) per hour.
When analyzed by screen category:
Total migration time:
853 / 16 + 1,902 / 24 = 133 hours (plus QA time for regression testing).
During this project, various screen types were involved, including Setup, Maintenance, Data Entry, Inquiry, and Processing screens.
No more guessing how long a migration will take.
Effort hours are tied directly to measurable complexity.
Whether analyzing 5 screens or 5,000, automation ensures consistency.
Customers receive detailed reports showing exactly what drives complexity.
Our algorithms power Sprinterra’s automated tools, reducing manual effort and shortening migration timelines.
With Acumatica’s Modern UI becoming the standard – and the Classic UI being phased out – customizations will require timely updates to stay compatible.
Sprinterra’s assessment methodology ensures:
If you missed the first article in this series, you can read it here:
https://www.sprinterra.com/moving-to-acumaticas-modern-ui-a-simple-guide-for-partners-and-customers/
Sprinterra provides:
If you’d like us to assess your customizations or run a pilot migration, we’re ready to help.
Get the latest insights on exponential technologies delivered straight to you
Because every customization is different, partners need a reliable way to understand how many screens require updates, how complex each migration will be, and how much effort is involved. Complexity analysis ensures predictable timelines, accurate budgeting, and reduced migration risks.
Sprinterra categorizes every screen into two groups:
Modified screens (standard Acumatica screens with developer changes)
Custom screens (fully custom-built screens)
Each category behaves differently during migration and receives a weighted effort factor.
Their assessment tool scans the XML/ASPX files and counts UI elements (“tags”) such as fields, grids, buttons, and layout components. Each tag represents one complexity point, forming the screen’s total score. A more granular weighted model is planned for future versions.
Sprinterra applies real-world productivity benchmarks:
Overall APR: 20 points/hour
Modified screens: 16 points/hour
Custom screens: 24 points/hour
The formula used is:
Total Hours = (Customized Points ÷ 16) + (Custom Points ÷ 24)
Regression testing is calculated separately.
The tool generates detailed reports including:
Full list of screens analyzed
Tag counts and complexity scores
Total effort estimation
Management-ready summary reports
These give customers complete transparency into migration requirements.
Key advantages include predictable migration timelines, accurate budgeting, scalable analysis for any number of screens, transparent reporting, and faster delivery through automation.
Acumatica is phasing out the Classic UI, meaning all customizations must be updated to the Modern UI to remain compatible with future releases. Early assessment ensures smooth transitions, reduced risk, and readiness for upcoming upgrades.
Yes. Sprinterra provides automated assessment tools, free evaluations for qualified partners, complete migration services, and optimization solutions to reduce QA effort.
We use cookies to improve your experience on our site. By using our site, you consent to cookies.
Manage your cookie preferences below:
Essential cookies enable basic functions and are necessary for the proper function of the website.
Google reCAPTCHA helps protect websites from spam and abuse by verifying user interactions through challenges.
Google Tag Manager simplifies the management of marketing tags on your website without code changes.
Statistics cookies collect information anonymously. This information helps us understand how visitors use our website.
Google Analytics is a powerful tool that tracks and analyzes website traffic for informed marketing decisions.
Service URL: policies.google.com (opens in a new window)
Clarity is a web analytics service that tracks and reports website traffic.
Service URL: clarity.microsoft.com (opens in a new window)
Marketing cookies are used to follow visitors to websites. The intention is to show ads that are relevant and engaging to the individual user.
LinkedIn Insight is a web analytics service that tracks and reports website traffic.
Service URL: www.linkedin.com (opens in a new window)
You can find more information in our Cookie Policy and Privacy Policy.